VecTcl
VecTcLab
VecTcLab
VecTcLab is a try to emulate the way of working with linear algebra packages such as Matlab, octave, or SciLab, within a Tcl/VecTcl powered environment. It consists of a modified tkcon, an interactive shell for Tcl, with all the necessary packages preloaded to do vector math and simple plotting. It can be found on the GitHub release page. When you fire up VecTcLab, a command window opens with an interactive prompt.
First, we will do simple matrix calculations
(VecTcLab) 29 % x={1 2 3}
{1 2 3}
(VecTcLab) 30 % A=x*x'
{{1 2 3}
 {2 4 6}
 {3 6 9}}
(VecTcLab) 31 % A * x
{14 28 42}
(VecTcLab) 32 %
Commands entered are first evaluated as a VecTcl expression, and on failure reevaluated as a Tcl command. This allows us to mix Tcl with math in VecTcl.
For instance, we construct a x-y dataseries for plotting
x=linspace(1,10,100); y=sin(x); 1
# Compute x-y data for a sine wave.
# the 1 is here to suppress the output
s=figure()
# a plot window appears
$s plot $x $y with linespoints pointtype squares
# the sine wave is plotted with connected squares
The plot should look like this:
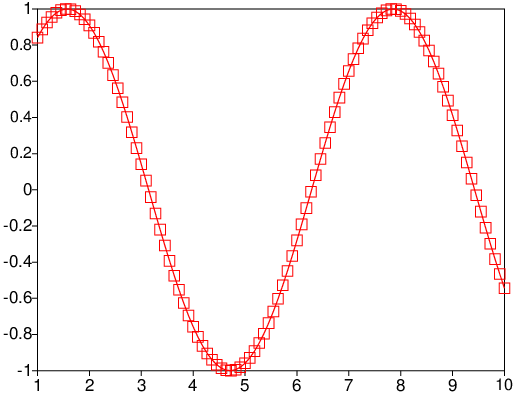 Drag a rectangle with the left mouse button to zoom into this plot. Clicking
with the right mouse button takes you back. Several properties of the plot
can be manipulated with commands inspired by gnuplot.
Drag a rectangle with the left mouse button to zoom into this plot. Clicking
with the right mouse button takes you back. Several properties of the plot
can be manipulated with commands inspired by gnuplot.
For instance, try
$s set log x
# switch x axis to logarithmic scale
$s set grid on
# display a regular grid of lines
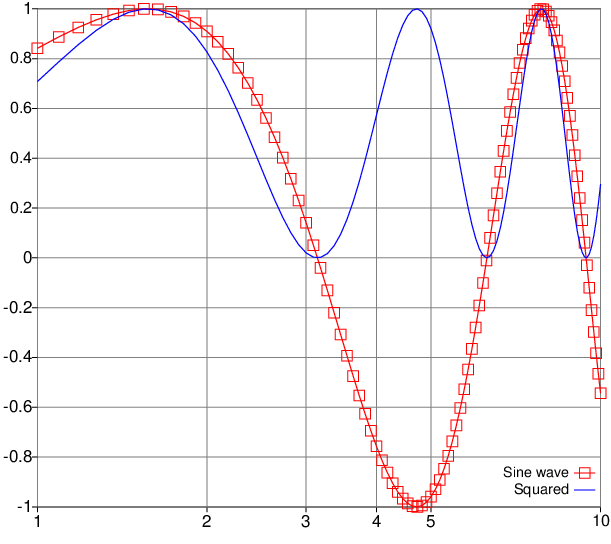
y2=y.^2
$s plot $x $y2 with lines color blue title "Squared"
# plot another curve on top, as a blue line
# and with a legend
$s set key bottom
# move the legend to the bottom
$s update 0 title "Sine wave"
# add a legend to the first dataset. The 0 is the
# dataset identifier, as returned from the plot command
$s saveAsPDF sinesqur.pdf
# write the current plot in PDF format to diskNow a PDF should be generated which should look like this: